For this assignment, I had the opportunity and honour to be working with the Spooders team again, compromising of my amazing groupmates Estelle, Jasreen, Justine, Lizandro and Tori.
We had our first experience so far in this bachelor program, where we had an amazing time working with an actual client and partner of the course. Living Soil Asia is an educational and research platform bringing social and soil communities into the ecosystem and climate change conversation, and they have presented the cohort with multiple briefs, with each group taking one each.
We had our first experience so far in this bachelor program, where we had an amazing time working with an actual client and partner of the course. Living Soil Asia is an educational and research platform bringing social and soil communities into the ecosystem and climate change conversation, and they have presented the cohort with multiple briefs, with each group taking one each.
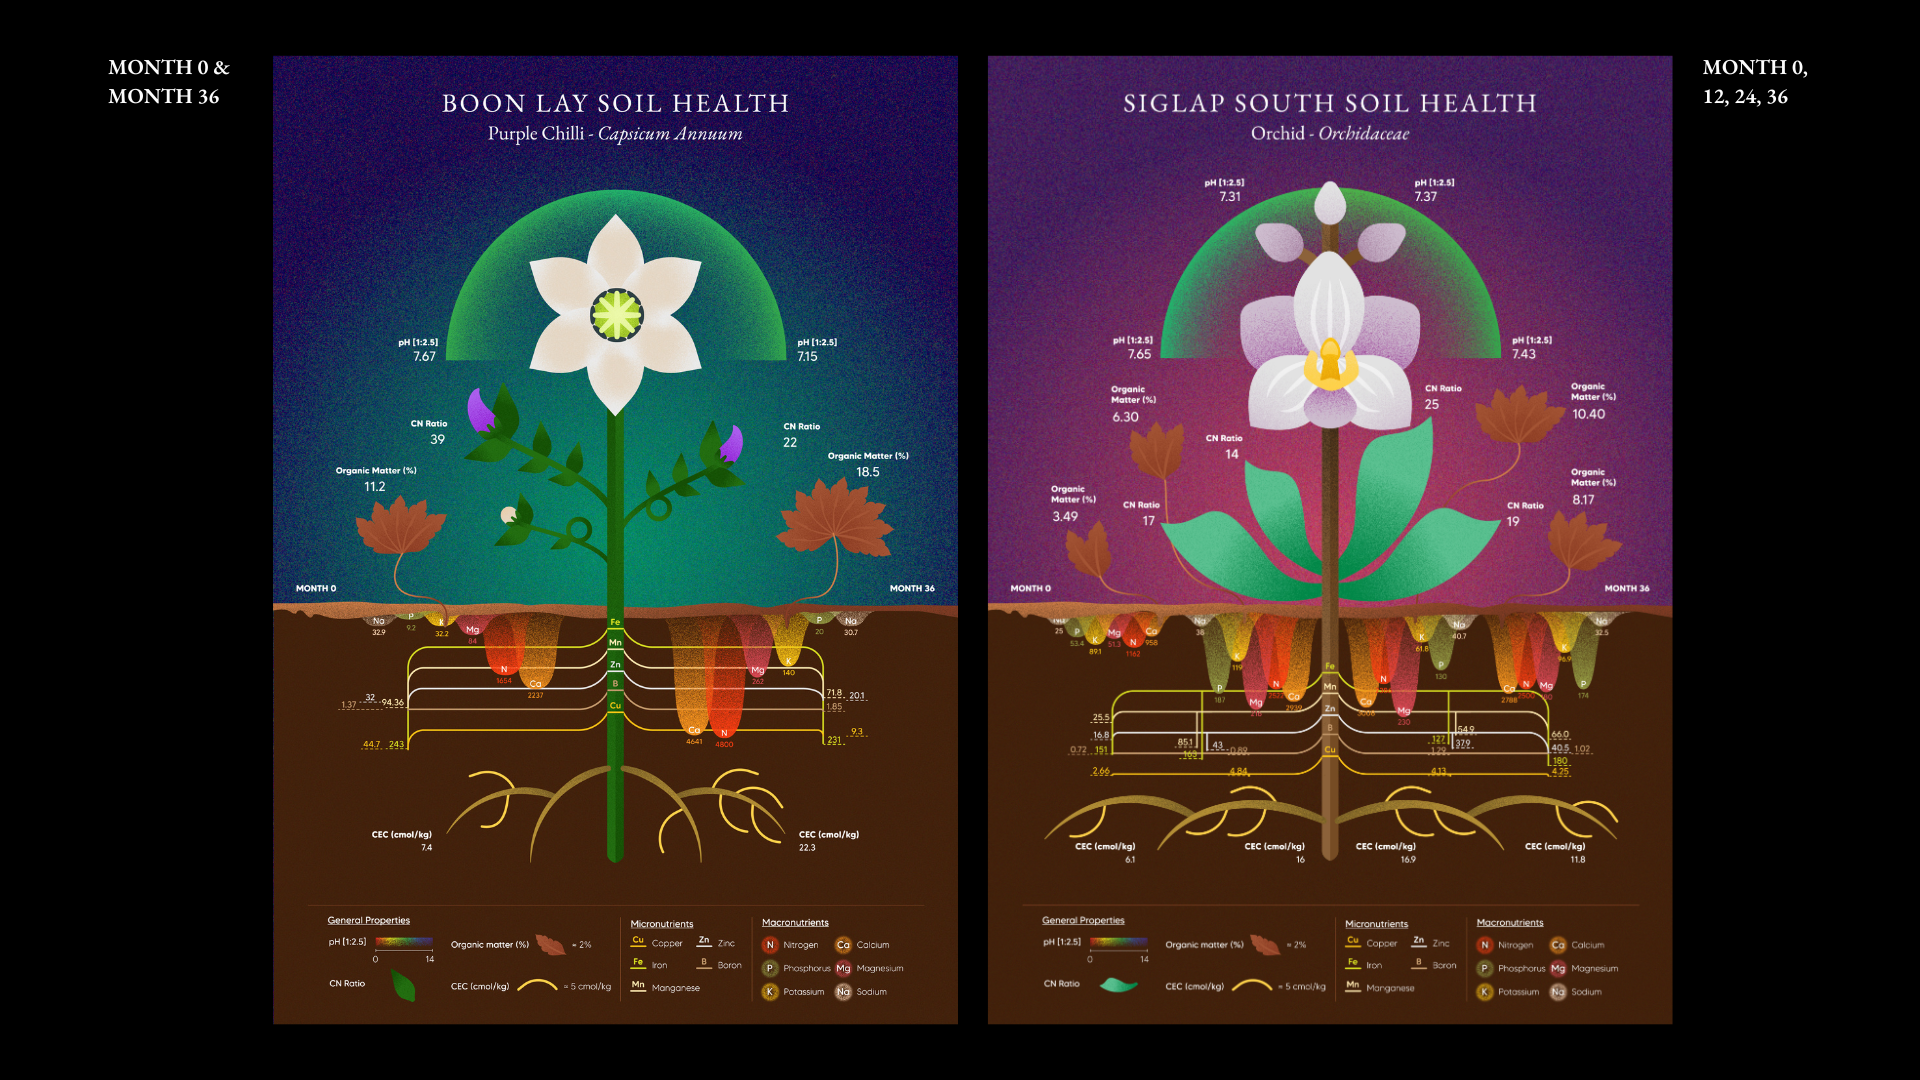
The Spooders team chose brief 2, which was a data visualisation and mapping assignment. Living Soil Asia presented us with a lengthy Word document full of numbers, representing soil health data across 8 nature gardens across Singapore. There are 10 nature gardens that they take care of in Singapore, but in the data we were only tasked to work with 8 of them.
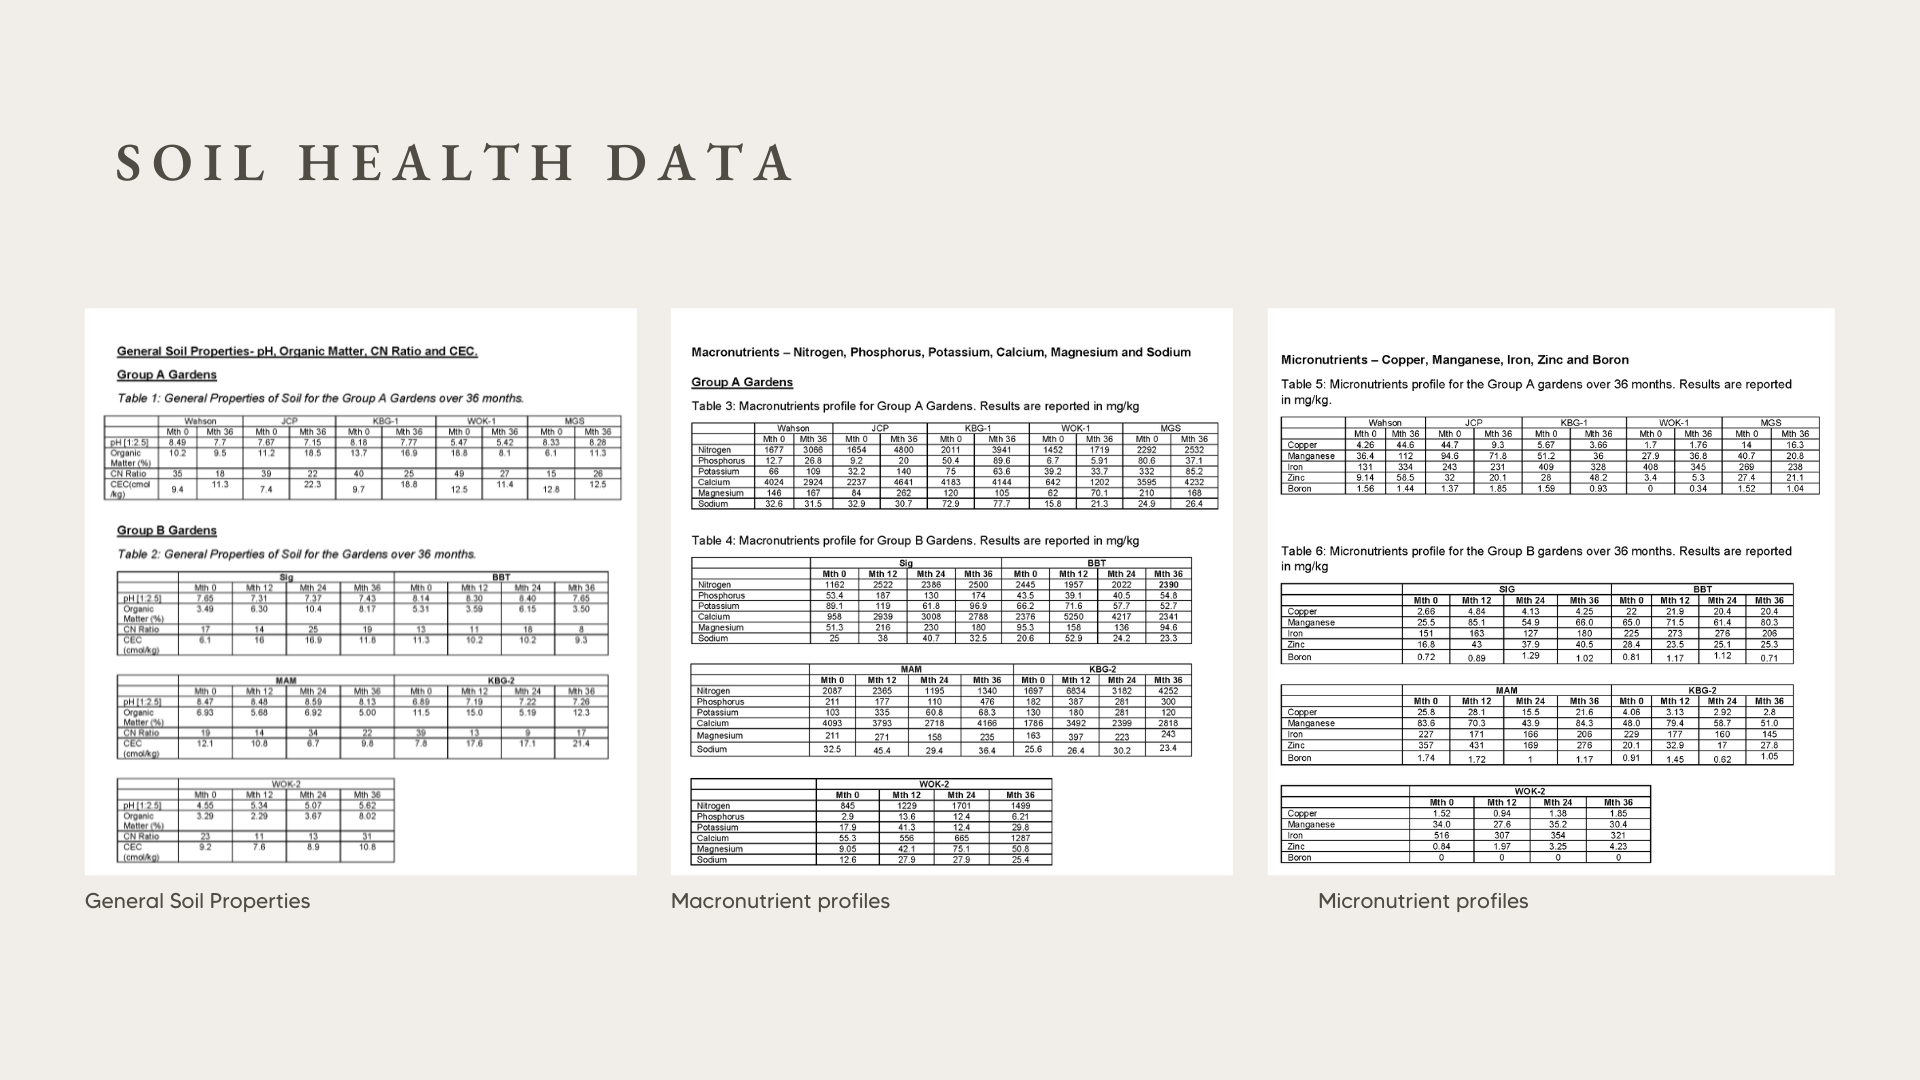
Amidst the bombardment of numbers, decimals and elements of the Science periodic table, the team went through numerous rounds of research, ideation, drafts in order to fully understand and make sense of the data, so as to allow ourselves to come up with ideas and designs that fully reflect the true meaning behind the data.
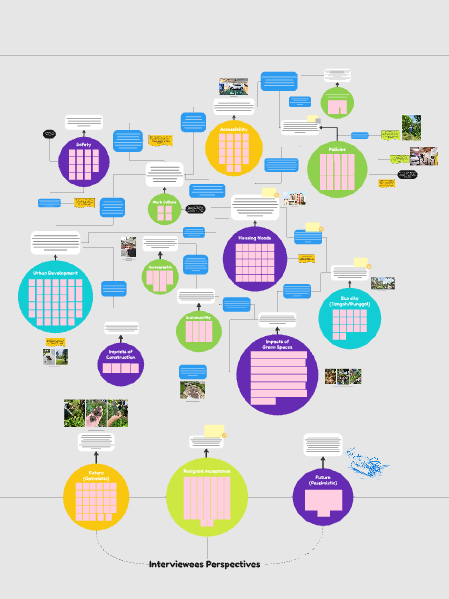
This is a video demonstration of our interactive map of the Living Soil Asia nature gardens across Singapore. The map shows the different gardens, presented using different plants which can be found at the gardens themselves, and upon clicking each garden, the soil health data of each garden can be seen. The user can also specifically read through the general soil properties, micronutrients and macronutrients found in the gardens' plot of land, where all of them work hand in hand to help the plant grow healthily and productively.
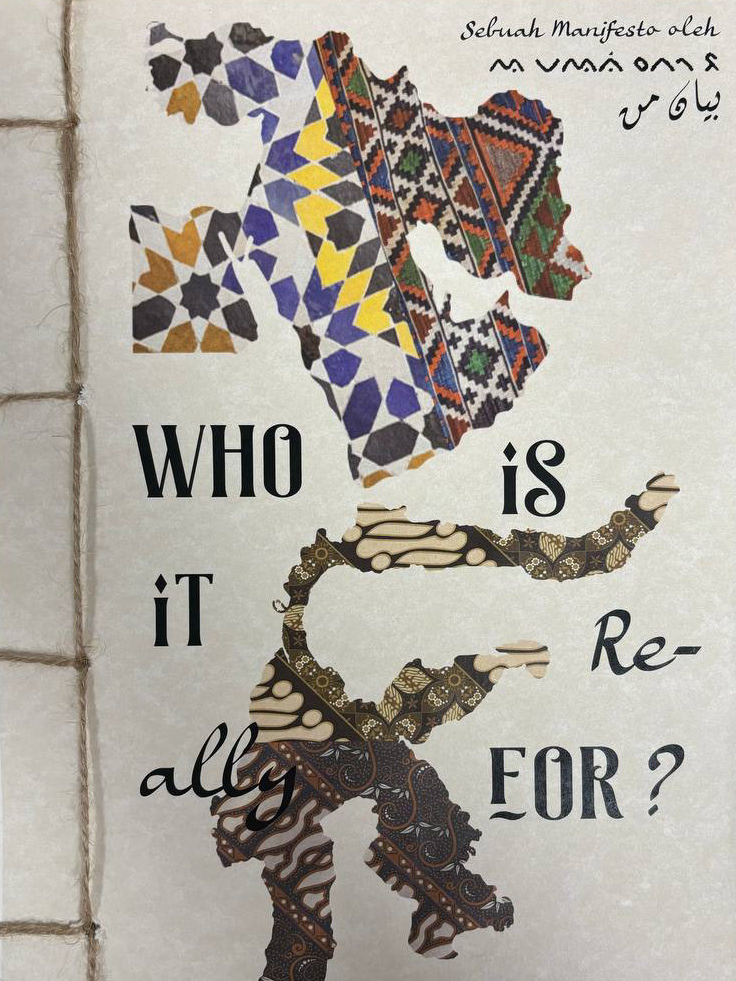
Using the Artificial Intelligence (AI) prowess of ChatGPT and Claude, the researchers of the team utilised them to gain a better understanding of the soil health data and for the AI to assist with crafting a captivating story of the meaning behind the numbers.
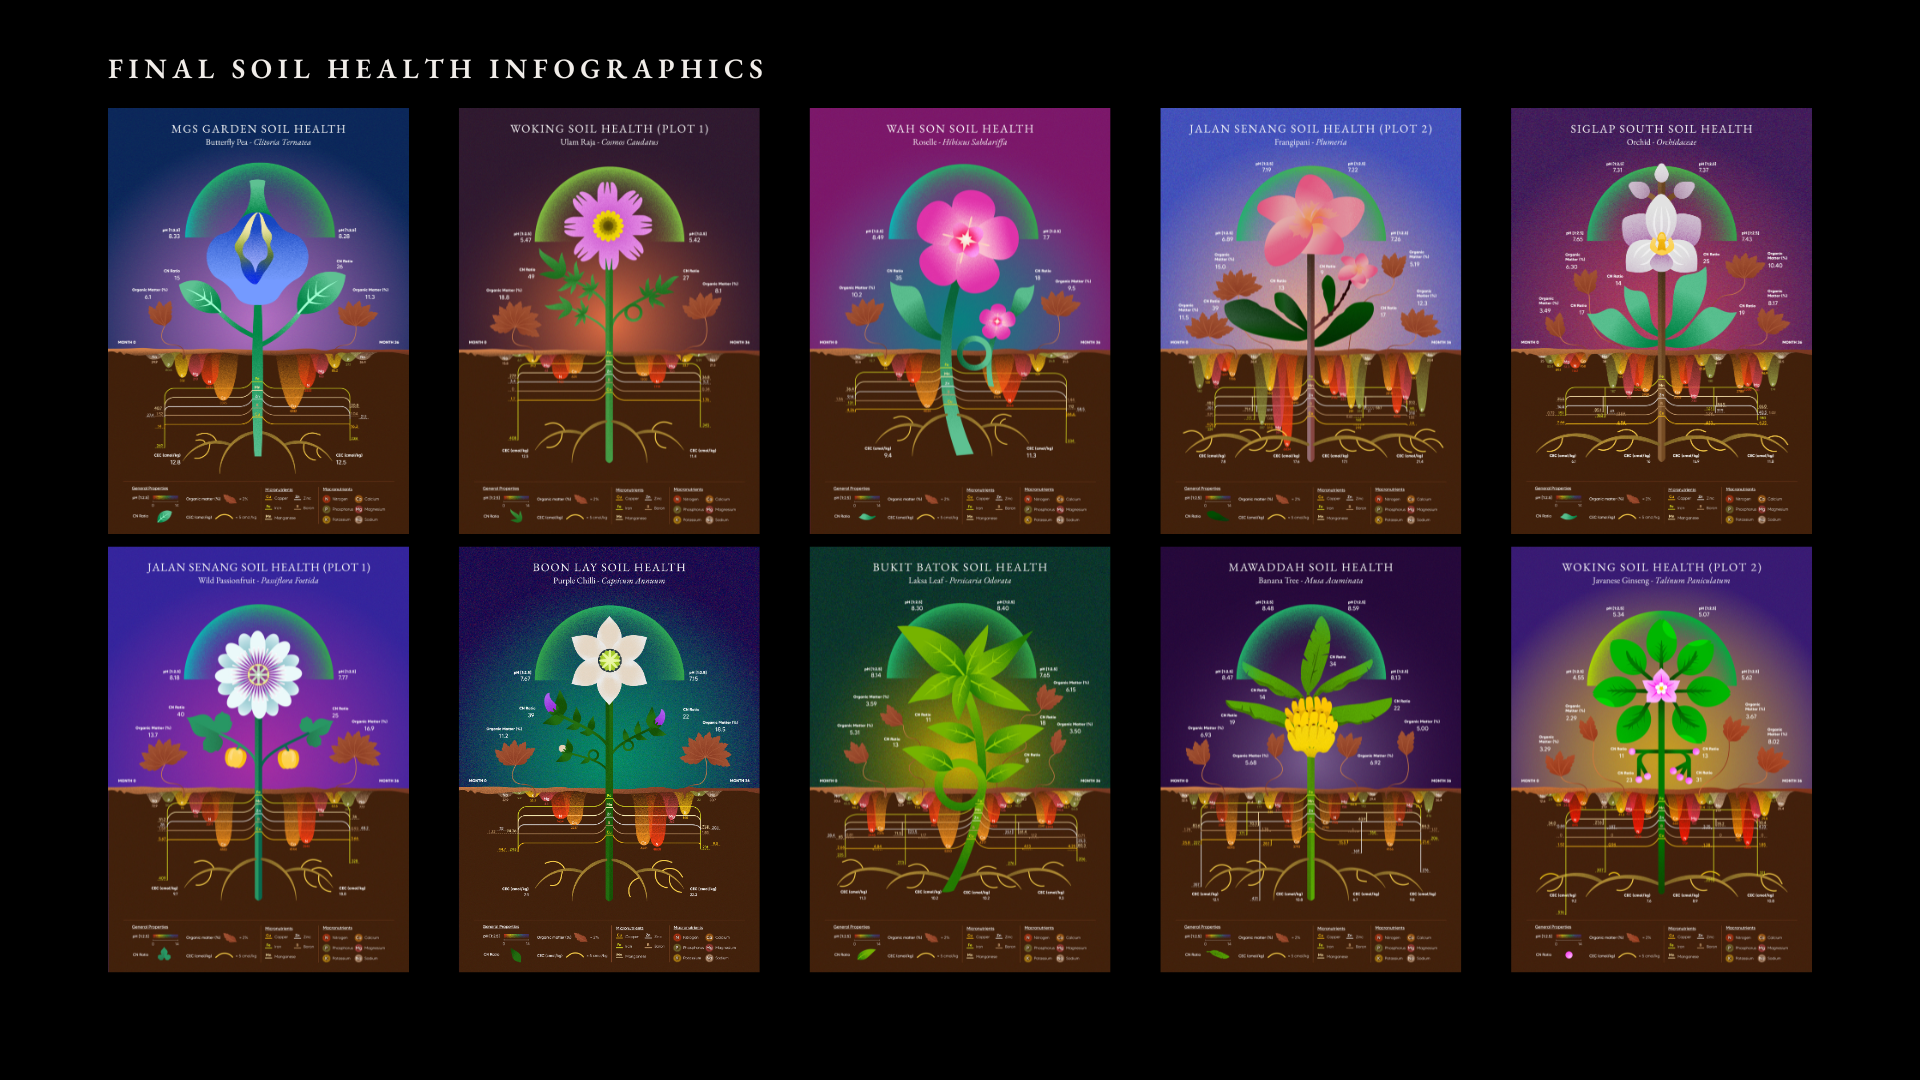
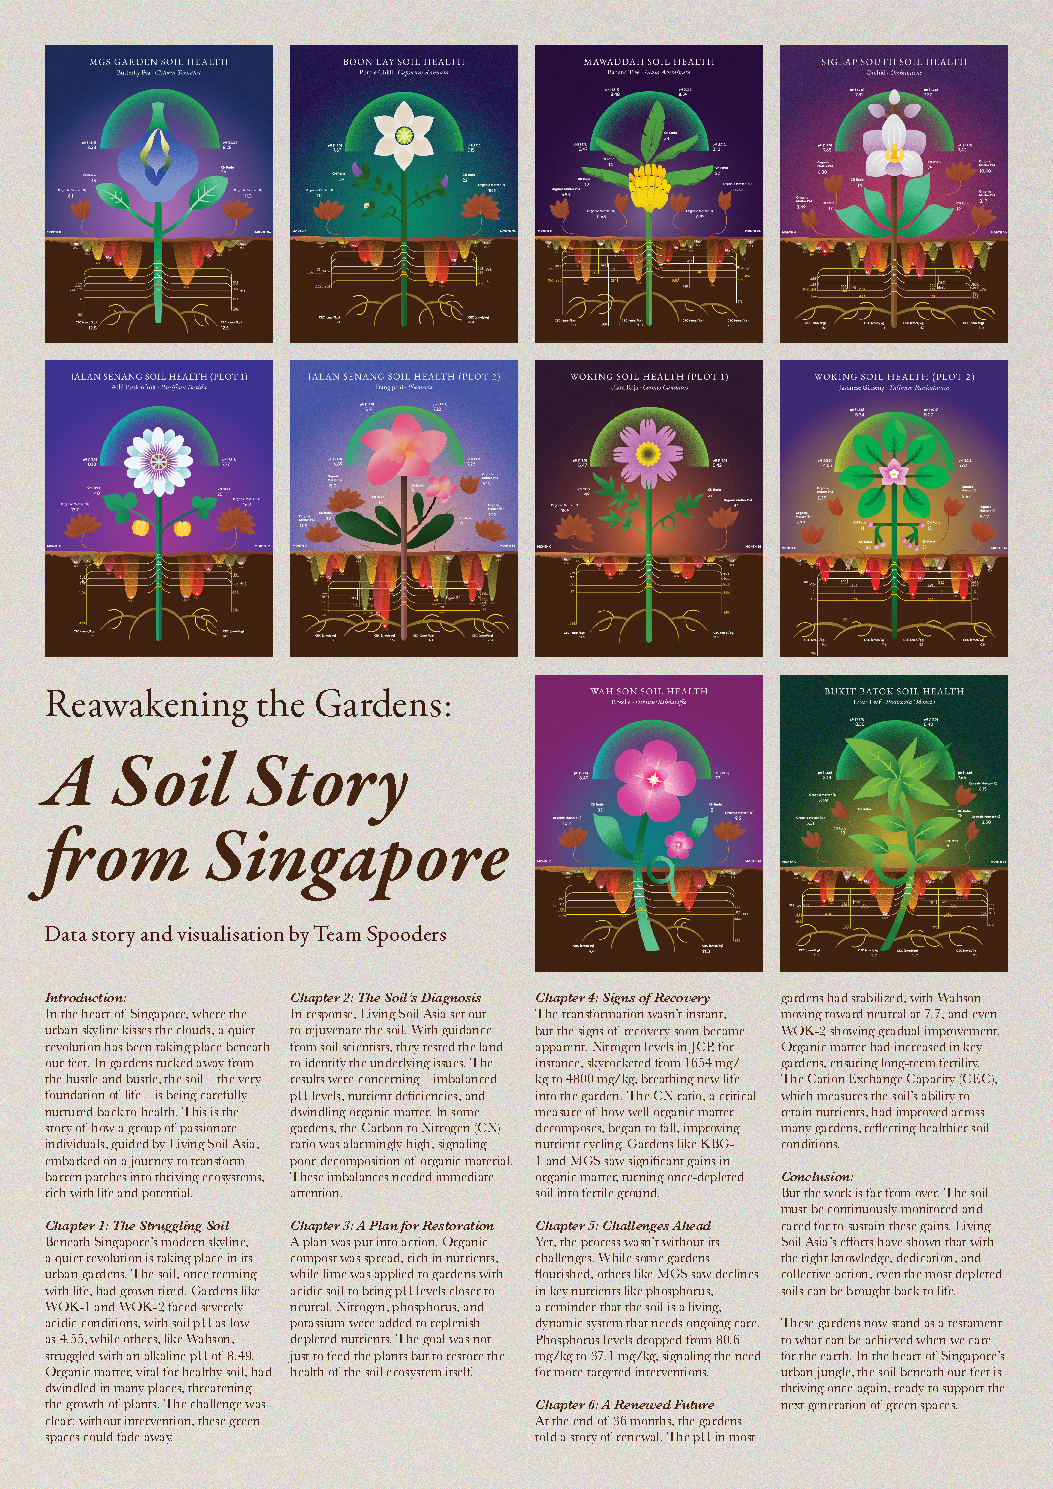
A summarised poster accompanied with the story was then designed by the designers of the team, as shown above.
For this project, I took on the role of Lead Copywriter, Field & Data Researcher and Designer. A presentation slide deck was crafted for when we had to present to a panel of our partners from Living Soil Asia, and during our first few rounds of ideations, Jasreen, Lizandro and I went down to the physical gardens in order to achieve much more nuanced understandings and insights regarding soil health and regen-agrihood.
Design wise, the amazing and highly-skilled Lead Designers of the team, Jasreen, Estelle and Tori, produced master files for everyone to refer to and use for our respective infographics we have been assigned to complete from our group leader. Having 10 infographics to design in total, along with the interactive map shown in the video at the top, the work had to be disseminated fairly in order to meet deadlines and produce quality work.